Published on October 06, 2025 (Updated on May 26, 2026)

North America's public charging infrastructure had a rough quarter. According to ChargeHub's proprietary data, the trouble-free success rate dropped to 58% between July and September 2025, wiping out the spring gains and pushing performance back below where it stood at the start of the yearar. Compounding this decline, 27%of charging attempts failed, a stark reminder of the sector's ongoing struggles during the peak summer season.

This edition covers July through September 2025, with comparisons against Q2 2025 and historical data stretching back to 2023.


Executive Summary

Q3 2025 brought the momentum that had been building since winter to an abrupt halt. After the all-time high recorded in April 2025, covered in our Q2 2025 Barometer, summer arrived with a wave of operational headaches that rippled across the entire continental network.

Global Performance Q3 2025: A Meaningful Step Backward

On average across the quarter, 58% of reported charging sessions went smoothly from start to finish, down 4 points from 62% in Q2 2025. That's not just a reversal of spring's progress; it also pulls performance below Q1 2025 levels.

Outright failure rates rose to 27%, up 2 points from the previous quarter. September was particularly rough, with a 29% failure rate across both the U.S. and Canada, placing it among the most difficult months in the past two years.

The year-over-year comparison makes the situation clear: Q3 2024 posted a 61.9% success rate, nearly 4 points better than this summer. Unlike the relatively flat trajectory between 2023 and 2024, this drop feels like more than a seasonal blip.

Q2 vs. Q3 2025 — United States and Canada

Indicator

Q2 2025

Q3 2025

Charged successfully without any issue

62%

58%

Reduced power or limited port availability

10%

11%

Charging initiated but difficult or interrupted

3%

4%

Charging failure

25%

27%


ChargeHub CEO Simon Ouellette doesn't mince words: "September 2025 is a yellow flag for the industry. Dropping to 54% success in Canada, the lowest we've seen in 30 months, raises real questions. After the promising results in Q2, a regression of this magnitude in Q3 is hard to ignore. Nothing should be taken for granted. We'd need to dig deeper to understand what drove such a stark difference between the two quarters."

Canada vs. United States Comparison: Shared Challenges Amid Geographic Asymmetries

Both markets moved in the same direction this quarter, and the numbers are now remarkably close: Canada at 58% success (down 4.7 points from Q2) and the U.S. at 58.3% (down 3.3 points). The gap between the two countries narrowed to just 0.3 points, compared to 1.1 points in Q2. The Canada–U.S. convergence tells a story of shared operational stress, though the steeper decline on the Canadian side is worth noting.
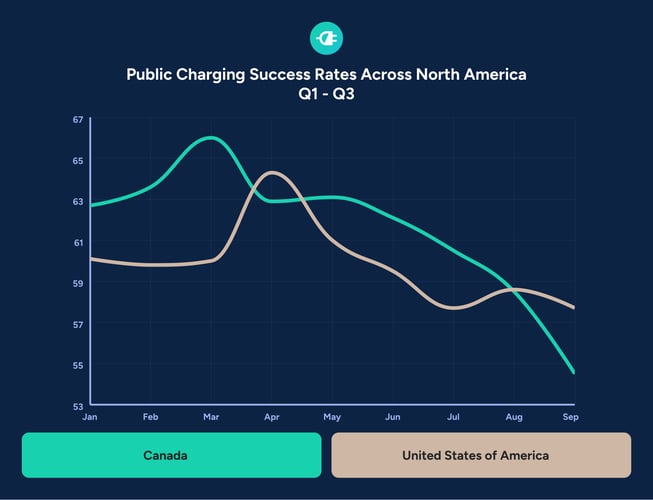
Canada vs USA public EV charging success rate comparison line chart Q1 to Q3 2025

Technical Reliability: More Sessions Going Sideways Mid-Charge

Two data points were particularly notable when it came to session quality.g The share of sessions that started but then became difficult or were cut short jumped to 4.3%, up 1.5 points from Q2's 2.8%. That's a rise of more than 50% in a single quarter, pointing to a real increase in mid-session disruptions.

Meanwhile, sessions that completed successfully but with reduced power or limited port availability held fairly steady at 10.3% (+0.3 points), suggesting that partial limitations aren't the main story. The bigger issue is sessions failing altogether.

Fall 2025 Outlook: Uncertainty Ahead for Q4

Fall 2024 averaged 60.2% success across North America, which means a meaningful recovery is within reach. But Q4 will also bring the first winter pressures, and the network will need to prove it can bounce back.

Simon Ouellette frames it well: "Difficult quarters like Q3 remind us how essential reliable infrastructure is twelve months a year. A passing grade isn't good enough. Drivers deserve a consistent, predictable experience no matter the season, and that's what will ultimately move the needle on EV adoption."

The real question heading into Q4: does the yellow flag turn red, or does performance find its footing again? The answer will tell us whether Q3 was a one-off or the start of something that needs to be addressed head-on.

The full analysis follows, including methodology, country-level breakdowns, direct comparisons, and a closer look at what Q4 2025 may bring.

Want the Q4 Barometer delivered to your inbox? Subscribe to our newsletter.
DETAILED ANALYSIS

The sections below walk through the full Q3 2025 dataset, with deeper dives by country and experience category. As with previous editions, the methodology remains consistent, making quarter-over-quarter and year-over-year comparisons as clean as possible.

Methodology

This analysis is based on ChargeHub's proprietary data collected between July and September 2025, covering the full North American public charging network.

Coverage: All 50 U.S. states and all Canadian provinces and territories, across all charger types (DCFC and Level 2), for operators visible in the ChargeHub app.

Four experience categories:

  1. Charged successfully without any issue: A seamless session, start to finish
  2. Charged successfully, but at reduced power or with limited port availability: Completed despite constraints
  3. Charging initiated but difficult or interrupted: Started, then went sideways
  4. Charging failure: Didn't work at all

Continental Results Q3 2025: Summer Pressure Takes Its Toll

The quarter averaged 58.1% of sessions trouble-free, down 3.9 points from Q2 2025's record-setting 62.0%. That puts Q3 below Q1 2025 and effectively cancels out six months of incremental progress.

Month

Charged without issues

Reduced power/port

Difficult/interrupted

Failure

July

59%

10%

3%

27%

August

59%

11%

5%

25%

September

56%

10%

5%

29%

Q3 Average

58%

10.3%

4.3%

27%

Q2 Average

62%

10%

3%

25%


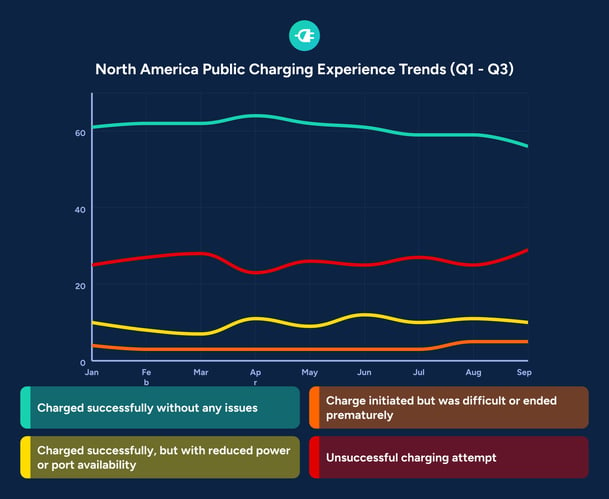
North America public EV charging experience trends multi-line chart Q1 to Q3 2025 success and failure rates

How Q3 Stacks Up Against Q2

Summer 2024 was relatively uneventful; Q3 came in at 61.9% compared to Q2's 61.7%, barely a blip. Summer 2025 is a different story. Performance dropped below 60% for the first time in several quarters, with every major metric moving in the wrong direction.

Analysis of the four measured categories:

  • Trouble-free sessions: Reversed the spring gains entirely
  • Outright failures: Back to Q1 2025 levels
  • Mid-session interruptions: Up more than 50% over the quarter, the sharpest shift of any category
  • Reduced power or limited availability: Held relatively steady

September closed the quarter at 56%, the network's weakest monthly showing since January 2024.

United States: A Flat but Frustrating Quarter

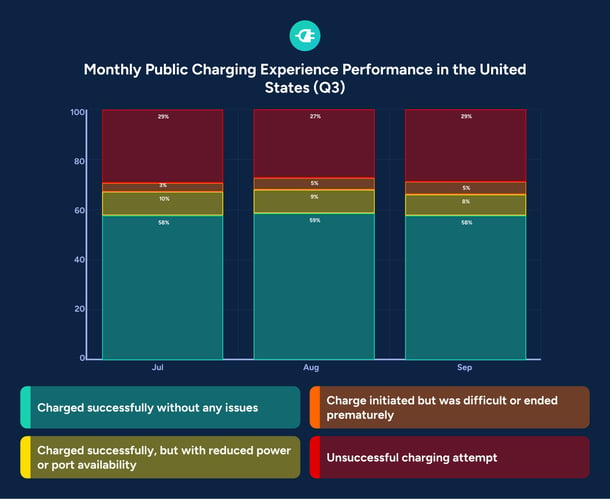
The U.S. averaged 58.3% success across the quarter, with results staying fairly consistent month to month, though consistently underwhelming.

Month

Charged without issues

Reduced power/port

Difficult/interrupted

Failure

July

58%

10%

3%

29%

August

59%

9%

5%

27%

September

58%

8%

5%

29%

Q3 Average

58.3%

9.0%

4.3%

28.3%

Q2 Average

61.6%

8.9%

2.9%

26.7%


United States monthly public EV charging experience performance stacked bar chart Q3 2025 July August September

What Defined the American Summer

Three things stood out in the U.S. data: persistently weak results, failure rates that refused to come down, and a notable rise in technical disruptions.

Maintaining Low Performance:

  • July and September show the highest failure rates of the quarter (29 %).

Increase in Technical Interruptions:

  • In August and September, 5% of initiated sessions were difficult or interrupted, the highest value recorded for this category since 2023.

Year-over-Year Comparison:

  • Success rates declined compared to Q3 2024 (59.9% → 58.3%).
  • This contrasts with the relative stability observed between Q3 2023 and Q3 2024, suggesting a break in the trajectory of continuous improvement.

Canada: September Sets a 30-Month Low

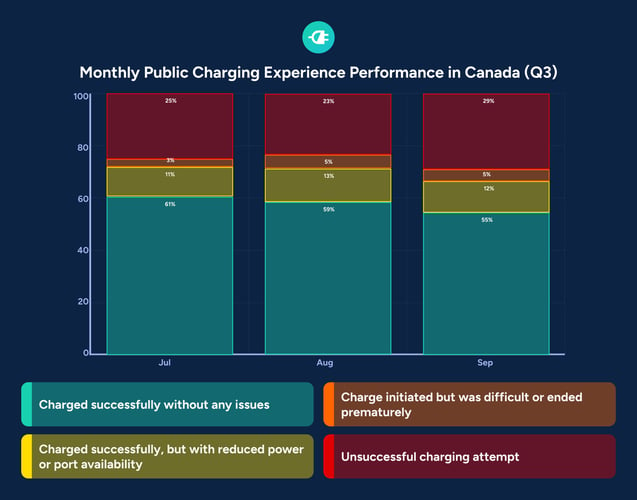
Canada's quarterly average came in at 58%, but the monthly trend tells a more alarming story: a steady slide through the summer that bottomed out at 54% in September — the worst single-month result in two and a half years.

Month

Charged without issues

Reduced power/port

Difficult/interrupted

Failure

July

61%

11%

3%

25%

August

59%

13%

5%

23%

September

54%

12%

5%

29%

Q3 Average

58%

12%

4.3%

25.7%

Q2 Average

62.7%

12.2%

2.8%

22.3%


Canada monthly public EV charging experience performance stacked bar chart Q3 2025 July August September decline

Strengths and Weaknesses Overview

Canada experienced the sharpest deterioration among the two North American markets in Q3, with a gradual decline throughout the summer culminating in a critical September.

September 2025: Historically Challenging Month

  • 54% success rate, the worst result since March 2023
  • 29% failure rate, equivalent to that of the United States
  • The success rate dropped by 7 points between July and September

Substantial Increase in Failures

  • Q3 average failure rate: 25.7%, up from 22.3% in Q2
  • August recorded the best result of the quarter (23%), followed by a sharp deterioration in September (29%)
  • Comparison with Q3 2024: Failure rate was 19.4% a year ago, representing a 6.3-point increase

Canada vs. U.S.: When Two Markets Move as One

Indicator

Q3 Canada

Q3 USA

Charged without issue

58%

58.3%

Reduced power/port

12%

9.0%

Difficult/interrupted

4.3%

4.3%

Charging failure

25.7%

28.3%


A Convergence That Tells a Story

The U.S. and Canada recorded almost identical results in Q3, marking a break from the historical gaps observed over the past two years. This convergence reflects shared operational challenges during the summer of 2025.

Convergence on Optimal Success

  • Success rate convergence: the U.S. recorded 58.3%, while Canada achieved 58% of sessions completed without issues.
  • In Q2 2025, the gap favored Canada by 1.1 points.
  • In Q3 2024, Canada held a 4.1-point advantage (64.2% vs. 60.1%).

Reduction of Canada’s Advantage on Failures

  • The gap decreased from 4.4 points in Q2 to 2.6 points in Q3.
  • Canada’s failure rate spiked sharply (+3.4 points) compared with a more moderate increase in the U.S. (+1.6 points).

Session Disruptions: A Shared Pattern

  • Comparable increases in both countries compared to Q2.
  • Both point to shared technical challenges during the summer months.

How the Two Markets Diverged from Q2

Both countries experienced a decline in Q3, but with distinct magnitudes and trajectories reflecting different operational dynamics.

Magnitude of Decline

  • Canada: -4.7 points (62.7% → 58%)
  • U.S.: -3.3 points (61.6% → 58.3%)
  • Canada recorded the most pronounced decline despite its historical advantage.

Increase in Failures

  • Canada: +3.4 points (22.3% → 25.7%)
  • U.S.: +1.6 points (26.7% → 28.3%)
  • The sharper increase in Canada reduced its historical advantage.

Q4 2025 Outlook: What Comes Next

Fall 2024 averaged 60.2% success across North America, a reasonable benchmark for what recovery could look like. The question is whether Q4 2025 can get there, especially with winter conditions starting to layer in.

The coming months will help answer a question that Q3 raised but couldn't resolve: Is this a seasonal anomaly, or the beginning of a structural problem? The difference matters a lot for how the industry responds.

Key Metrics to Monitor

  • Canada: Can September's 54% be written off as an outlier, or does it signal something deeper?
  • United States: Will failure rates and mid-session disruptions start to come back down?
  • Continental: Does Q4 bring a partial rebound or a continuation of the summer slide?

ChargeHub Solutions for Operators and Businesses

ChargeHub works with charging network operators and businesses to help optimize infrastructure performance and improve the end-user experience. Learn more about our solutions for industry professionals.

Get the Q4 2025 Barometer: Subscribe to our professional newsletter for quarterly editions and exclusive industry analysis.