Published on July 30, 2025 (Updated on August 26, 2025)

Executive Summary

In this third edition of ChargeHub’s Charging Experience Barometer, we highlight the results from the first quarter of 2025. Public charging performance across North America improved overall, thanks mainly to a significant increase in successful charging sessions in Canada. This result stands out, especially considering that harsh winter conditions usually bring Canada’s performance down. Yet, for the first time in two years, Canada outperformed the United States during this key period. Meanwhile, the U.S. maintained its usual level of stability.


Highlights

  • The rate of successful charging sessions increased to 61.6% in Q1 2025, up from 58% in Q1 2024.

  • The U.S. held steady, with 60% of sessions completed without issues in line with the trend over the past two years.

  • Canada bounced back, outperforming the U.S. in terms of issue-free sessions. Success rates matched those typically seen in summer, a season that usually sees better performance.

  • Charging experiences became more polarized, with fewer sessions falling somewhere in between. More users either had an entirely successful session or none at all.

Introduction

While public charging infrastructure continues to expand in both the United States and Canada, it remains a significant obstacle for potential EV buyers, hindering the adoption of electric vehicles.

A June 2025 J.D. Power study confirms that the top concern among prospective EV owners is still the availability of public charging stations. Among the 41% of respondents who expressed hesitation about purchasing an EV, more than half cited the lack of accessible chargers as a key reason for their decision. This concern has remained consistent since 2024, while other factors, such as vehicle cost, have become less critical.

These findings reinforce the need for tools that can accurately evaluate and monitor the reliability of the charging infrastructure. ChargeHub created the Charging Experience Barometer to meet this need, offering a clear snapshot of what EV drivers experience on the road.

Our methodology

Since January 2023, ChargeHub has published a quarterly analysis based on user feedback collected through its app. With over a million users each year, the app gives an accurate picture of public charging conditions, based on real-world experiences from EV drivers. Our analysts sort through user feedback and group it into the following categories:

Comment Examples

Our team reviews all user comments, but only those directly related to the charging experience are included in this analysis. 

First Quarter 2025: An Unexpected Performance

This report covers the performance of the first quarter of 2025 (January to March). Historically, this time of year tends to fall below the annual average, mainly due to harsh winter conditions affecting results in Canada.

Public Charging Success Rates Across Canada and USA Q1 2025

3 mo AVG

Minimum Monthly Value

Maximum Monthly Value

Charged successfully without any issues

61%

61%

62%

Charged successfully, but at reduced power or with limited port availability

8%

7%

10%

Charged was initiated, but was difficult or ended prematurely

3%

3%

4%

Charging attempt was unsuccessful

27%

25%

28%


In the previous edition of the barometer, when reviewing 2024 Q4 data, we observed that charging reliability dropped from 62% in November 2024 to 58% in December 2024. This aligned with the 7% decline between December 2023 and January 2024, during which the success rate decreased from 63% to 56%, while the failure rate increased from 21% to 28%.

Historically, this decrease in success rate at the end of the fall was the prelude to the winter months, which had significantly lower success rates than the warmer months.

However, the latest data shows a surprising increase in successful charging sessions from January to March 2025 relative to previous winters. Success rates even reached levels comparable to the best single-month performances of any month over the past two years.

2024 Combined


2024 Combined (1)


Key insights - Overall

  1. Performance exceeded expectations

  •  The average success rate, meaning charging sessions completed without any issues, reached 61.6% for the quarter. This marks a significant increase from 58% in 2024.

  • The most significant improvements occurred in January, with a 61% success rate in 2025 compared to 56% in 2024, and in February, rising to 62% from 58%. March showed a smaller increase but remained consistent with the overall trend at 62% compared to 60%.

  1. Charging experiences were more polarized

  •  Analysis of user comments reveals greater polarization as more sessions are classified as either entirely successful or completely unsuccessful.

  • The share of intermediate experiences, such as charging successfully but with reduced power or limited port availability, and charging initiated but difficult or interrupted, decreased notably. This decline was particularly evident in February, as the rate fell from 16% in 2024 to 11% in 2025.

  1. Failure rates show minor fluctuations

  • In January, the failure rate dropped by 3% compared to the previous year, moving from 28% to 25%.

  • However, failure rates increased by 2% in both February and March, reaching 27% and 28% respectively.

  • Despite these changes, overall performance remained more stable than expected, contrary to predictions of a sharper decline during winter months based on data from earlier years.

These unexpected results prompted our analysts to take a closer look at the data, breaking it down by country to gain a better understanding of what may have caused the shift. By analyzing the performance of the United States and Canada separately, we can more clearly identify the patterns and factors behind the changes.

Given the overall improvement observed this quarter, two main hypotheses may explain the results:

  1. A general improvement in public charging performance in the United States, which has typically outperformed Canada during this time of year

  2. A weaker impact of winter conditions on Canada’s performance, resulting in stronger results compared to those seen in early 2024

The following sections explore each country’s performance in detail to test these hypotheses.

How Public Charging Performed in the USA (Q1 2025)

This section presents the success rate of smooth public charging sessions in the United States during the first quarter of 2025. Over the past two years, public charging networks in the country have shown greater consistency throughout the year, with an average success rate of 59% and an average failure rate of 27%.

Public Charging Success Rates Across USA Q1 2025

3 mo AVG

Minimum Monthly Value

Maximum Monthly Value

Charged successfully without any issues

60%

50%

60%

Charged successfully, but at reduced power or with limited port availability

8%

6%

10%

Charged was initiated, but was difficult or ended prematurely

4%

3%

5%

Charging attempt was unsuccessful

28%

25%

32%


When the December 2024 results were compiled, the positive experience rate in the USA stood at 60%, slightly above the 24-month average. This trend continued through the first quarter of 2025, with the rate holding steady at 60% for each of the three months observed.

USA 2025


2025 USA 2024 vs 2025


Key observations for the US charging experience

  1. Stable performance, consistent with expectations

  • The rate of successful charging sessions remains steady at 60% across all three months observed.

  • Compared to 2024, January shows a three-point improvement, while February and March each gain one point.

  1. Experience polarization continues, following the same trend seen across North America

  • As highlighted in the combined USA–Canada analysis, mid-range experiences were less common. Users were more likely to report either very positive or negative sessions.

  • In February, mid-range ratings declined from 16% in 2024 to 11% in 2025.

  • A similar pattern appears in March, with a decrease from 12% to 9%.

  • January is a slight exception, with mid-range ratings rising from 14% to 15%.

  1. Moderate changes in failure rates

  • January saw the most significant improvement in failed sessions, dropping by 4 points to 25% (from 29% in 2024).

  • Failure rates then rose again in the following months.

  • In February, the rate increased by 5 points to 29% (compared to 24% in 2024).

  • March recorded a more modest rise, reaching 32% compared to 29% the year before.

In summary, the first quarter performance of public charging networks in the US meets expectations from ChargeHub analysts. The results indicate relative stability with limited fluctuations, consistent with trends observed over the past two years.

How Public Charging Performed in Canada (Q1 2025)

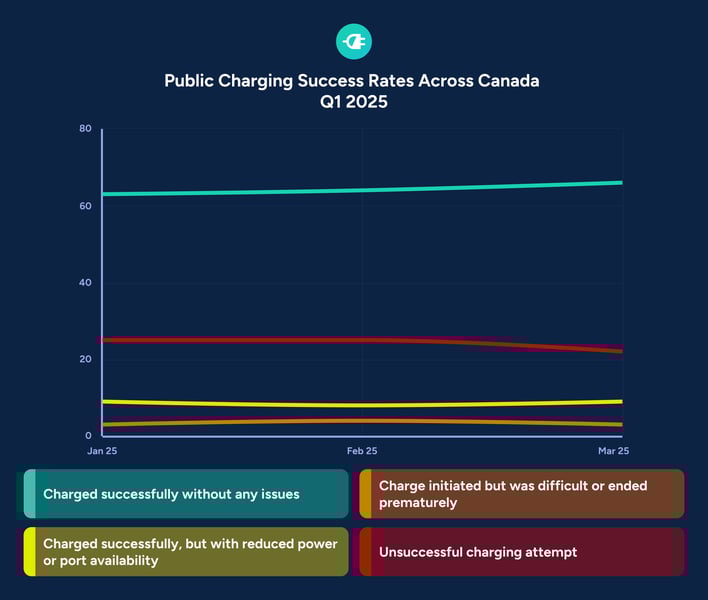
The data below shows the success rate of charging sessions at public stations across Canada in the first quarter of 2025. Unlike in the USA, winter conditions have a greater impact on Canadian performance, typically resulting in a noticeable decline in successful charging sessions without any issues at the beginning of the year.

Public Charging Success Rates Across: Canada Q1 2025

3 mo AVG

Minimum Monthly Value

Maximum Monthly Value

Charged successfully without any issues

64%

63%

66%

Charged successfully, but at reduced power or with limited port availability

8%

8%

9%

Charged was initiated, but was difficult or ended prematurely

3%

3%

4%

Charging attempt was unsuccessful

23%

22%

25%


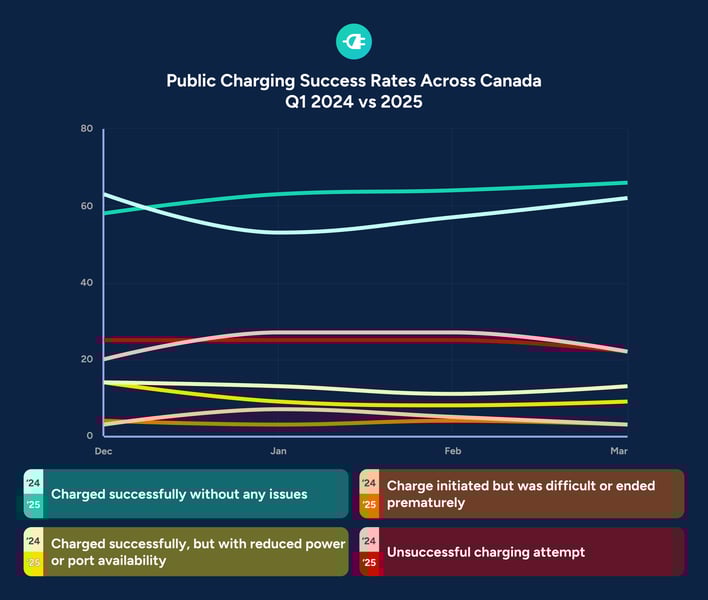
Over the past two years, Canada has averaged a yearly success rate of 62% for charging sessions, which is three points higher than the USA. Historically, however, Canada’s performance tends to dip below the USA rates during the first quarter of each year before overtaking the USA for the remainder of the year.

This time, first-quarter data reveal an improvement that even surpasses Canada's summer averages from the past two years. Although December 2024 saw the usual drop in smooth charging sessions, falling from 62% in November to 58% in December, the first quarter of 2025 shows a clear rebound. This is a historical first for this period.

CAN 2025


2024 Combined-2


Key observations for the Canadian charging experience

  1. Winter performance exceeded expectations

  • In January, the success rate for charging sessions reached 63%, a 10-point increase compared to 2024 and 3% higher than the US rate for trouble-free sessions.

  • February and March followed the same trend, with gains of 7% (from 57% to 64%) and 4% (from 62% to 66%), respectively.

  • The success rate for Q1, usually the lowest of the year, is now comparable to Canada’s best-performing months.

  1. Polarized user experience continues

  • Ratings in all intermediate satisfaction categories declined compared to the same period last year, indicating a more polarized overall experience.

  1. Failure rates declined slightly, even in winter

  • Slight decrease in the charging failure rate for the first two months of the quarter, with a 2% drop in January and February 2025 (from 27% to 25%).

  • The failure rate remained steady at 22% in March 2025.

Canada delivered a surprisingly strong performance, well above typical winter trends. Whether this marks the beginning of a new normal or just a temporary exception remains to be seen in the months ahead.

This improvement could be due to milder winter impacts on the charging experience, or it might reflect a lasting shift, something future data will help clarify.

That said, ChargeHub analysts believe the main factor is the sharp drop in domestic EV sales during winter 2025. With fewer new EV drivers on the road, fewer first-time users were relying on public charging. As a result, the overall driver knowledge of public charging was higher than usual in Q1, leading to a better success rate.

Conclusion and implications

The results for the first quarter of 2025 highlight stability in the United States and a significant improvement in performance in Canada. Canada surprised many by posting a notable recovery during a historically unfavourable period. This improvement is the main reason for the overall increase in the rate of trouble-free sessions at public charging kiosks in North America. 

One question remains: is this improvement the result of milder winter impacts, an overall boost in infrastructure reliability, or increased driver knowledge? Future editions will reveal whether this signals a one-off improvement or the beginning of a sustained rise in reliable charging experiences across Canada.

ChargeHub Charging Experience Barometer Reports

The Charging Experience Barometer – 2024 Edition

The Charging Experience Barometer – 2023 Edition