 FIND A STATION
 STORE
STORE









 Get the app



Global Performance Q4 2025: The Rebound That Didn't Come
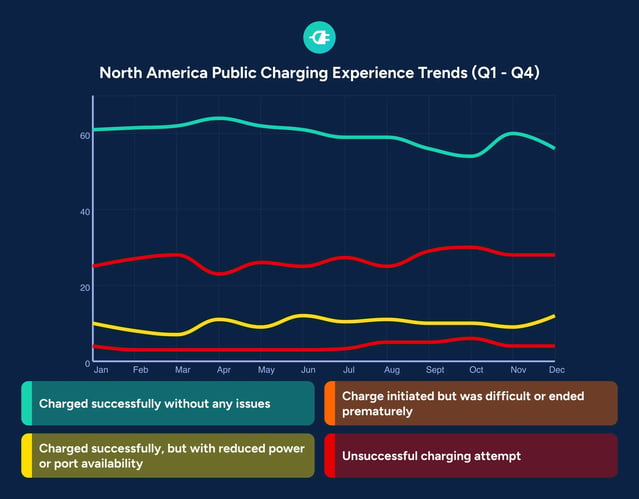
After Q3's summer slide, Q4 was expected to bring at least a partial recovery, in line with what happened in fall 2024. It didn't. On average across the quarter, 56.7% of reported charging sessions were completed without any issues, down 1.4 percentage points from Q3's already weak 58.1%. That puts Q4 2025 a full 3.5 points below Q4 2024's 60.2%.
The failure rate rose to 28.4%, up 1.4 points from Q3's 27.0%. October was particularly difficult: 30% of reported sessions failed across North America, the highest monthly failure rate observed since our barometer began tracking sessions in early 2023.
Q3 vs. Q4 2025 — United States and Canada
|
Indicator |
Q3 2025 |
Q4 2025 |
|---|---|---|
|
Charged successfully without any issue |
58.1% |
56.7% |
|
Reduced power or limited port availability |
10.3% |
10.4% |
|
Charging initiated but difficult or interrupted |
4.3% |
4.4% |
|
Charging failure |
27.0% |
28.4% |
"Any single quarter can be noisy. What Q4 gives us is a second data point that helps distinguish real trends from statistical variation. Q1 2026 will be the third, and that's when we'll have a much stronger read on where things stand," says Simon Ouellette, CEO of ChargeHub.
Canada vs. United States: The Gap Widens in a New Direction
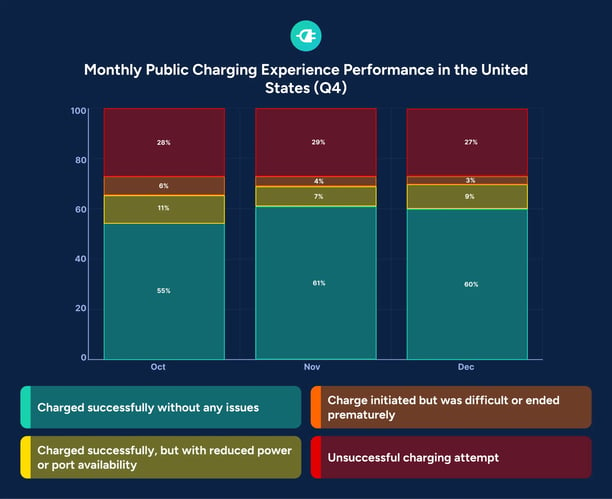
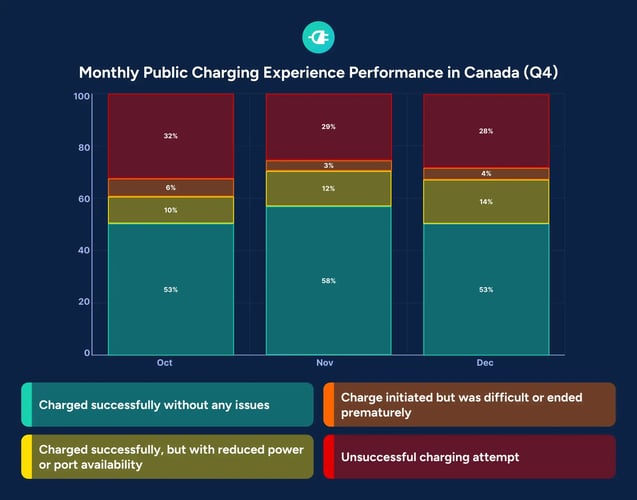
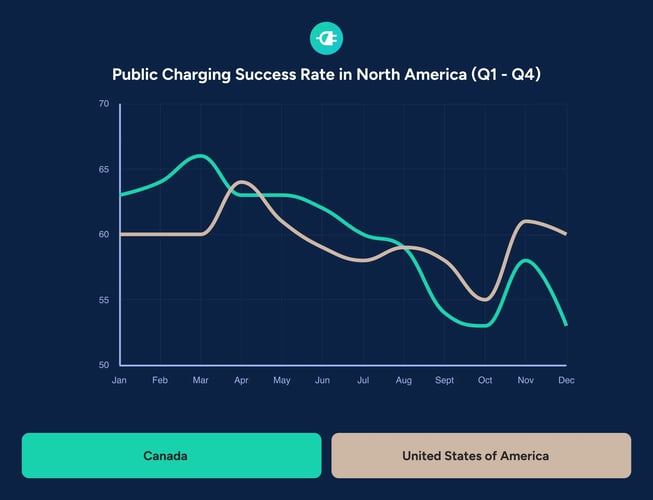
The narrow U.S. lead that emerged in Q3 (0.3 points) turned into a clear 4-point gap in Q4. The U.S. posted 58.7% success, Canada 54.7%. This is the largest U.S. advantage over Canada recorded across three years of quarterly analysis. The U.S. had only briefly led Canada twice before: in Q1 2023 (+2.4 points) and Q1 2024 (+1.4 points), both during harsh winter periods.
Canada's October result of 53% stands as its worst monthly figure since data collection began. The failure rate in October reached 32%.
Technical Reliability: October Disruptions Stand Out
Sessions that started but went sideways mid-charge spiked to 6% in October across North America, the highest reading recorded for this category in the barometer's history. November brought it back down to 4%, and December settled at 4%. October stands as an unexplained outlier in the Q4 data, since November and December, both colder and busier, saw the rate normalize.
Q1 2026 Outlook: Can the Network Find Its Footing?
Q1 2024 averaged 58.0% success across North America. That's a reasonable benchmark for what a recovery could look like. But Q1 also brings the full weight of winter, which historically pushes both failure rates and mid-session disruptions higher, as the January 2025 data already showed (61% success, but with a 4% rate of difficult/interrupted sessions).
"Coming off two difficult quarters, Q1 2026 will tell us whether what we're seeing is a cyclical dip or a structural erosion. The infrastructure has shown it can perform when conditions are favorable. The real test is whether operators have done the maintenance and monitoring work necessary to perform when conditions aren't," adds Simon Ouellette, CEO of ChargeHub.
The full analysis follows, with methodology, country-level breakdowns, and a direct Canada–U.S. comparison.
Want the Q1 2026 Barometer delivered to your inbox? Subscribe to our newsletter.